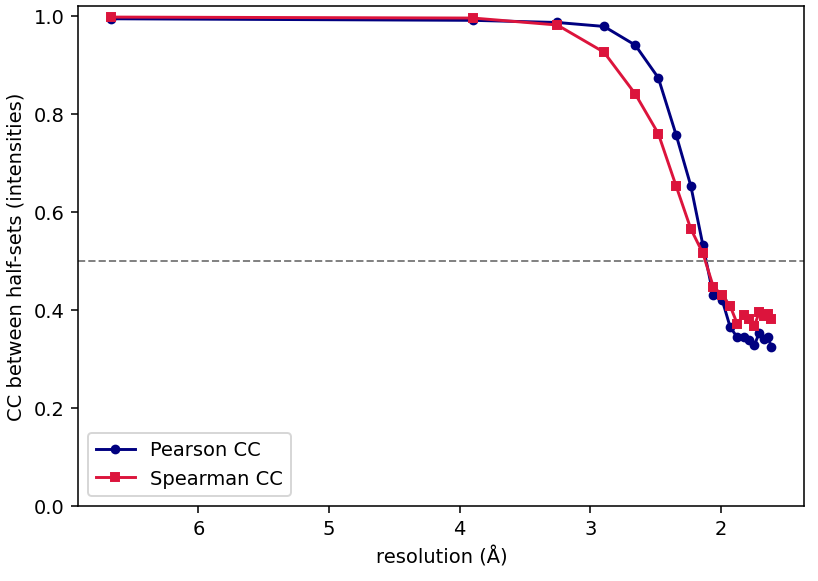
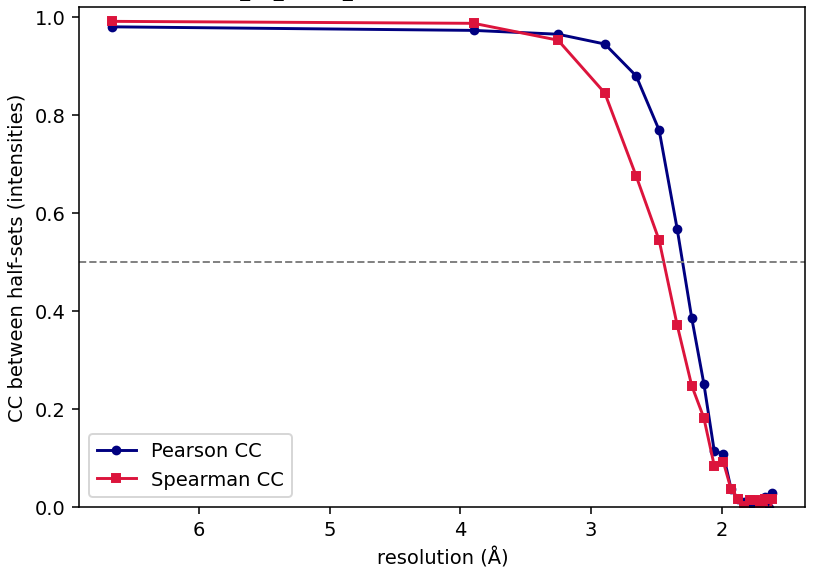
I am interested in understanding what is going on here, and if I can expect any systematic error/mischief in the xsphere data, or progress those with confidence. Has anyone seen this before or have any insight?
@taw I feel bad bugging you all the time, but: who else would know???
Interesting plots. Now that you mention it, I think I’ve seen this effect myself although I never paid attention to it.
It’s just a fact of modelling that adding degrees of freedom to a fit will always “improve” the figures of merit. I think that’s what’s going on here: the extra degrees of freedom have absorbed some of the difference between the two half-datasets, creating a weak correlation.
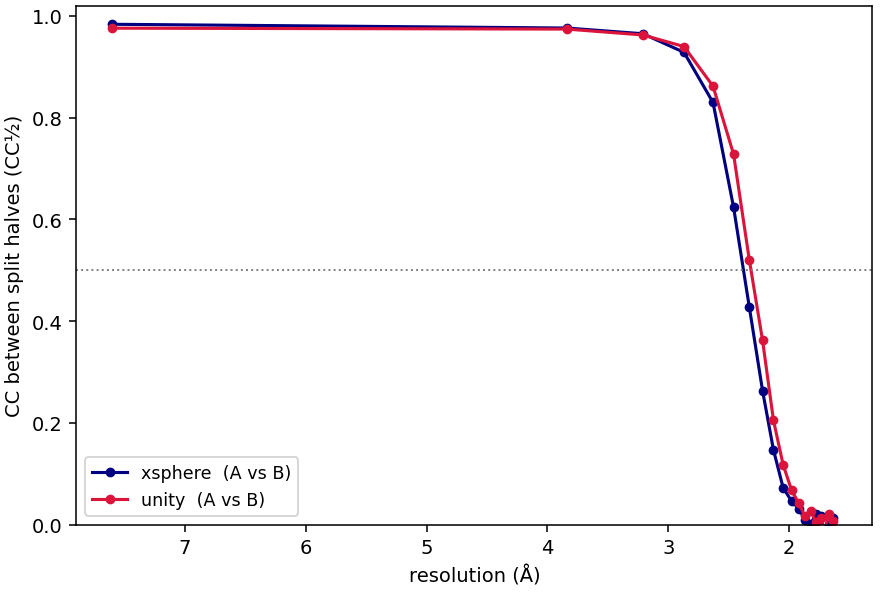
To test this, you could try manually splitting the stream (needs a bit of script hacking since scripts/alternate-stream doesn’t work on recent data) and running partialator twice for each model (four times in total). I think the correlation will go away.
Your account makes sense as well, thanks! Basically at low resolution, xsphere might be able to overfit to noise (if I understood correctly).
Not sure if that overfitting would have any significant negative effect on the data. It makes me a little nervous but on the other hand: the maps and R-factors look good.
What a nice demonstration! It’s surprising how similar the graphs become for unity and xsphere.
For now, I don’t have any good answers about big a deal the over-fitting is, although no-one is likely to mistake a CC of 0.4 for usable data. But introducing new parameters to the fit, in this case the crystal orientation, will never make the correlation come out worse.
The reason for the combined post-refinement — that includes “custom split” mode as well as the hkl1 and hkl2 files for calculating R_{split} — is a related but opposite effect. It could also be that post-refinement with many parameters (i.e. more than just scaling factors) doesn’t have a unique solution, and you see artificial differences if you do separate post-refinements. This would be analogous to how separate scaling+merging runs can arrive at the same result multiplied by an overall scaling factor. It seems better not to risk artificial differences that might get interpreted as e.g. time-resolved changes, and instead to make the differences as small as possible.
I noted at the end of my latest paper that it might be possible to get real answers about these questions by “abusing” the Millepede method for merging intensity data. So watch this space…